Project 2: Analyzing OpenStreetMap Data | Data Wrangling with MongoDB
- Author: Chi-Yuan Cheng (cyuancheng AT gmail DOT com)
- Last updated: May 1th 2015
Map information:
- Map Area: Santa Barbara County, CA, United States
- The dataset can be found here
- I choose Santa Barbara, CA because I have lived and worked there for 6 years.
Questions:
1. Problems encountered in your map
-
Obtaining the OSM data:
I have a problem downloading the OSM file from the OpenStreetMap website. As suggesting by the project instruction, I downloaded the OSM file from Map Zen.
-
Understanding data structure:
One challenge was to understand the context and structure of the OSM data. We can use Python ElementTree to parse the data. We can also use UNIX "grep" comment to read the data.
-
Loading json data into MongoDB:
I have a problem importing the json data into MongoDB using pymongo. I found it is faster and easier to import json data using "mongoimport", and query a collection in the mongo shell.
-
Data cleaning:
Several street names have no street types and also some other errors. The uncorrected and corrected street names are in the "changes" and "skip" dictionaries in this document. I manually changed these errors in "shape_element" function. I also changed many similar street types to a non-abbreviated form after discovering these issues in the audit. The corrections are in this document.
Additionally, I fount there are several inconsistent labeling elements of amenities when querying. For example, "Starbucks" vs "Starbucks Coffee" and "In-N-Out" vs "In-N-Out Burger". I corrected these inconsistent names using MongoDB, as following.
    db.sb.update({'name':"Starbucks"},
        {"$set":{"name" : "Starbucks Coffee"}},{multi:true})
before: { "_id" : "Starbucks Coffee", "count" : 6 }
after: { "_id" : "Starbucks Coffee", "count" : 15 }
2. Overview of the data
-
File sizes:
OSM file is about 175 MB JSON file is about 198 MB -
Datasize:
> db.sb.dataSize() 2066303408 -
Number of document:
> db.sb.find().count() 7424821 -
Number of node:
> db.sb.find({"type":"node"}).count() 7136237 -
Number of way:
> db.sb.find({"type":"way"}).count() 284368 -
Number of created users
> db.sb.distinct("created.user").length 438 -
Number of cafes
> db.sb.find({"amenity":"cafe"}).count() 350 -
Number of shops
> db.sb.find({"shop":{$exists:1}}).count()
2157
3. Other ideas about the datasets
-
The top 5 contributed users
>db.sb.aggregate([ {'$match': {'created.user':{'$exists':1}}}, {'$group': {'_id':'$created.user', 'count':{'$sum':1}}}, {'$sort': {'count':-1}}, {'$limit' : 5}]) { "_id" : "woodpeck_fixbot", "count" : 2694493 } { "_id" : "nmixter", "count" : 837826 } { "_id" : "Apo42", "count" : 542586 } { "_id" : "Eureka gold", "count" : 347793 } { "_id" : "USWilderness", "count" : 331834 } -
The top 5 popular cuisines
> db.sb.aggregate( [ {'$match': {'amenity':'restaurant', 'cuisine':{'$exists':1}}}, {"$group":{"_id":"$cuisine", "count":{"$sum":1}}}, {"$sort":{"count":-1}}, {"$limit":5}]) { "_id" : "american", "count" : 85 } { "_id" : "mexican", "count" : 56 } { "_id" : "pizza", "count" : 46 } { "_id" : "seafood", "count" : 39 } { "_id" : "burger", "count" : 37 } -
The top 5 popular schools
> db.sb.aggregate([ {"$match":{"amenity":"school", "name":{"$exists":1}}}, {"$group":{"_id":"$name", "count":{"$sum":1}}}, {"$sort":{"count":-1}}, {"$limit":5}] ) { "_id" : "Lemonwood Elementary", "count" : 32 } { "_id" : "Isla Vista Elementary School", "count" : 22 } { "_id" : "Oxnard High School", "count" : 16 } { "_id" : "Santa Barbara College", "count" : 16 } { "_id" : "Wilson School", "count" : 16 } -
The top 5 appearing amenities
> db.sb.aggregate([ {"$match":{"amenity":{"$exists":1}}}, {"$group": {"_id":"$amenity", "count":{"$sum":1}}}, {"$sort":{"count":-1}}, {"$limit":5}]) { "_id" : "parking", "count" : 3071 } { "_id" : "school", "count" : 2507 } { "_id" : "place_of_worship", "count" : 2459 } { "_id" : "restaurant", "count" : 856 } { "_id" : "telephone", "count" : 760 } -
The top 5 popular fast food
> db.sb.aggregate([ {'$match': {'amenity':'fast_food', 'name':{'$exists':1}}}, {"$group":{"_id":"$name", "count":{"$sum":1}}}, {"$sort":{"count":-1}}, {"$limit":5}]) { "_id" : "McDonald's", "count" : 70 } { "_id" : "Subway", "count" : 56 } { "_id" : "Panda Express", "count" : 39 } { "_id" : "Wendy's", "count" : 31 } { "_id" : "Jack in the Box", "count" : 24 } -
Other Idea:
1. The most populated district in Santa Barbara County
I want to know the most populated district in Santa Barbara County, so I did the following MongoDB query based on postcode.
  > db.sb.aggregate( [
      { '$match' : { 'address.postcode' : {'$exists' : 1}}},
      { '$project' : {'postcode' :
                      { '$substr' : ['$address.postcode', 0, 5]}}},
      { '$group' : {'_id' : '$postcode',
                   'count' : { '$sum' : 1 }}},
      { '$sort' : {'count' : -1}},
                  { '$limit' : 5} ] )

  { "_id" : "93117", "count" : 545 }
{ "_id" : "93436", "count" : 428 }
{ "_id" : "93101", "count" : 333 }
{ "_id" : "93001", "count" : 207 }
{ "_id" : "93033", "count" : 109 }
The most populated district is 93117, which is Goleta city. I live in this area.
2. Wheelchair accessible amenities in Santa Barbara County.
I want to know which amenities are wheelchair accessible.
> db.sb.aggregate([
    { '$match' :{'amenity' : {'$exists' : 1},
                 'wheelchair' : 'yes'}},
    { '$group' : { '_id' :  '$amenity' ,
                   'count' : { '$sum' : 1 }}},
    { '$sort' : {'count' : -1}},
    {'$limit' : 5}])

{ "_id" : "fast_food", "count" : 24 }
{ "_id" : "toilets", "count" : 16 }
{ "_id" : "fuel", "count" : 16 }
{ "_id" : "hospital", "count" : 16 }
{ "_id" : "restaurant", "count" : 8 }
Fast food is the most wheelchair accessible amenity in Santa Barbara. Next, we can find out which fast food provides wheelchair service.
> db.sb.aggregate([
    { '$match' :{'amenity' : 'fast_food',
                 'wheelchair' : 'yes'}},
    { '$group' : { '_id' :  '$name' ,
                   'count' : { '$sum' : 1 }}},
    { '$sort' : {'count' : -1}},
    {'$limit' : 5}])

{ "_id" : "In-N-Out Burger", "count" : 16 }
{ "_id" : "McDonald's", "count" : 8 }
Interestingly, only two fast food restaurants provide wheelchair service in Santa Barbara.
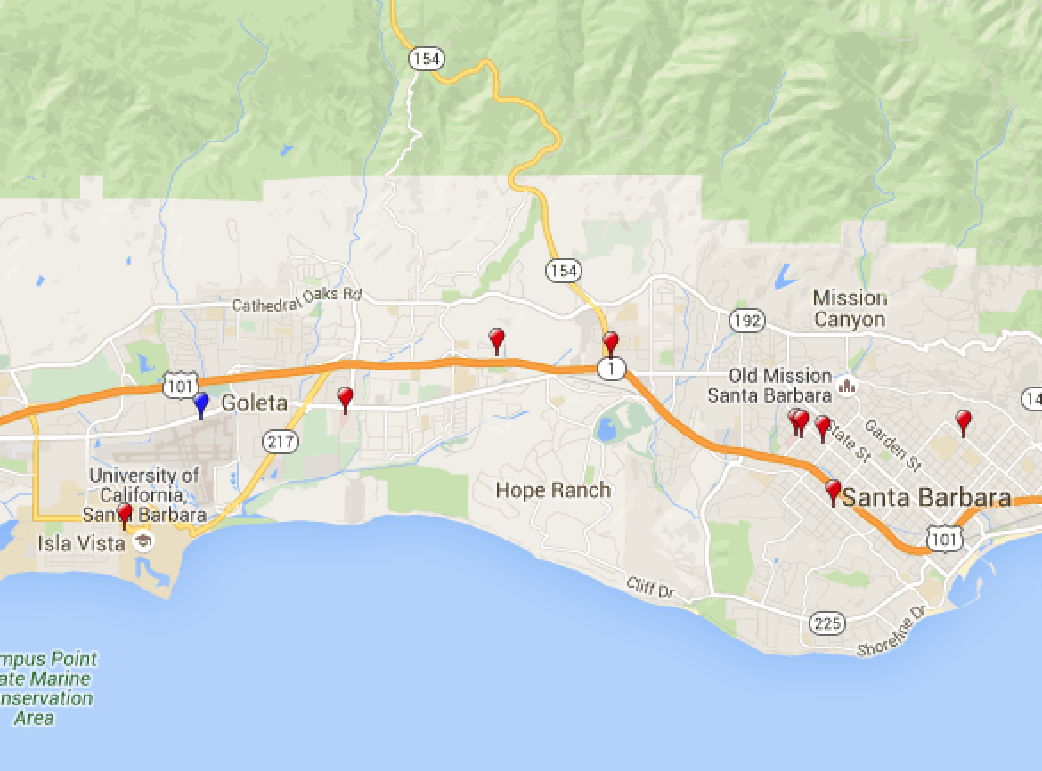
3. Find the closest hospital from my current location
The greatest benefits of OSM data is for disaster preparedness and risk management. For example, OSM can help facilitate the delivery of goods and services in the Nepal earthquake disaster. A recent study suggests that Southern California may have a 7.7 magnitude earthquake in future, so we have to prepare.
In this regard, I used OSM to find the closest hospital from my current location in Santa Barbara area. The code can be find here (ipynb). The map for hospitals are shown below (blue bubble: current position, red bubble: hospital).
Conclusion:
There are still many opportunities to clean and validate the OSM data in which I did not explore. It would be very helpful if we could update, validate, and/or pull missing information of the OSM data from other sources, such as Google Maps API.